WVXU: Coronavirus hitting rural communities hard
UC assistant professor Diego Cuadros explains latest national trends for COVID-19

WVXU's Cincinnati Edition talked to a University of Cincinnati epidemiologist about how mortality rates from COVID-19 are surging now in rural America.
Assistant professor Diego Cuadros, director of UC's Health Geography and Disease Modeling Lab, told host Michael Monks that the pandemic is especially dire in rural counties of high-infection states.
Cuadros is part of UC's Geospatial Health Advising Group, which has issued several policy briefs to help health officials respond to the global pandemic. The group is composed of health, geography and statistical modeling experts from the UC College of Pharmacy and the UC College of Arts and Sciences.
"We started in Ohio analyzing health data in Ohio and looking at differences between rural and urban areas. The epidemic spread faster in urban than rural areas. But that was in the early stages of the epidemic," Cuadros said.
But now, Cuadros said, rural areas are seeing a surge in infections with higher mortality rates in rural counties of high-infection states. This is cause for concern because the population in rural areas skews older than that of urban areas. Likewise, rural areas typically have fewer medical resources, particularly intensive-care units.
"The epidemic doesn't behave exactly the same everywhere," Cuadros said.
Listen to the Cincinnati Edition segment.
Read more about Diego Cuadros' work in the latest issue of UC Magazine.
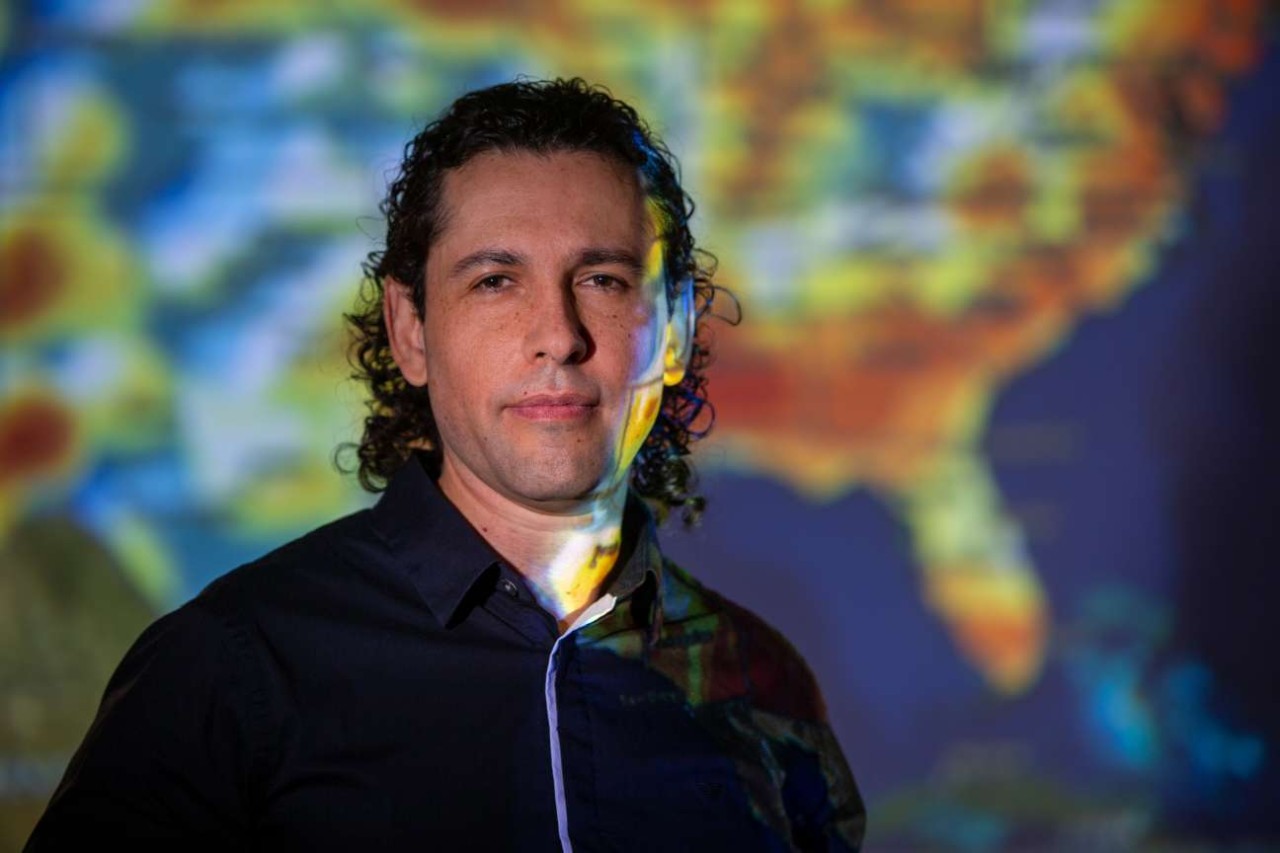
Featured image at top: UC assistant professor of geography Diego Cuadros is part of UC's Geospatial Health Advising Group, which has been tracking the COVID-19 pandemic in Ohio and the United States. Photo/Andrew Higley/UC Creative + Brand

A bivariate map compares mortality rates in the early months of the COVID-19 pandemic compared to the most recent months. Dark green indicates high mortality rates in the early part of the pandemic. Purple indicates high mortality in more recent months. And black represents high mortality on both periods. Graphic/UC Geospatial Health Advising Group
Related Stories
How to keep birds from flying into your windows
July 3, 2024
UC College of Arts and Sciences professor Ron Canterbury tells the Indianapolis Star that simple steps can prevent birds from strike windows around your home or business. Yahoo! News shares the story.
WalletHub: 5 best chip and pin credit cards
July 1, 2024
University of Cincinnati director discusses 5 best chip and pin credit cards with WalletHub
WVXU: Supreme Court temporarily blocks key air pollution...
July 1, 2024
University of Cincinnati law professor spoke with WVXU about recent Supreme Court decision to temporarily block key air pollution regulations.